데이터 일차 가공 및 모델 학습/예측/평가
** 데이터 로드 **
imbalanced, 284807건 중 492건 이 fraud 0.172%
feature engineering 다양하게, 중요 feature : 정규분포, log 변환 // 이상치, smote 오버 샘플링 : fraud data 뻥튀기
log 변환은 왜곡된, 치우친 분포도의 데이터를 정규분포화하는 엔지니어링 방식
Inter Quantile Range를 이용한 Outlier Removal 박스플롯
언더 샘플링 많은 레이블을 적은 수준으로 감소 불균형시 해소하려고
오버 샘플링 적은 레이블을 많은 수준으로 증식
SMOTE(Synthetic Minority Over-Sampling Technique) - k최근접이웃으로 사잇값 렌덤 데이터 신규증식, 증식으로 오버 셈플링 완료
import pandas as pd
import numpy as np
import matplotlib.pyplot as plt
import warnings
warnings.filterwarnings("ignore")
%matplotlib inline

card_df = pd.read_csv('./creditcard.csv')
card_df.head(3)
# amount 카드 사용액
# class 0은 정상, 1은 비정상 : 우리는 1을 찾기 위함

	Time	V1	V2	V3	V4	V5	V6	V7	V8	V9	...	V21	V22	V23	V24	V25	V26	V27	V28	Amount	Class
0	0.0	-1.359807	-0.072781	2.536347	1.378155	-0.338321	0.462388	0.239599	0.098698	0.363787	...	-0.018307	0.277838	-0.110474	0.066928	0.128539	-0.189115	0.133558	-0.021053	149.62	0
1	0.0	1.191857	0.266151	0.166480	0.448154	0.060018	-0.082361	-0.078803	0.085102	-0.255425	...	-0.225775	-0.638672	0.101288	-0.339846	0.167170	0.125895	-0.008983	0.014724	2.69	0
2	1.0	-1.358354	-1.340163	1.773209	0.379780	-0.503198	1.800499	0.791461	0.247676	-1.514654	...	0.247998	0.771679	0.909412	-0.689281	-0.327642	-0.139097	-0.055353	-0.059752	378.66	0
3 rows × 31 columns
card_df.shape

# (284807, 31)
원본 DataFrame은 유지하고 데이터 가공을 위한 DataFrame을 복사하여 반환
from sklearn.model_selection import train_test_split
# 데이터 사전가공 함수 : 데이터 log변환, OD, 각 적용 후 예측 성능 평가
# 인자로 입력받은 DataFrame을 복사 한 뒤 Time 컬럼만 삭제하고 복사된 DataFrame 반환
def get_preprocessed_df(df=None):
    df_copy = df.copy()
    df_copy.drop('Time', axis=1, inplace=True)
    return df_copy
학습과 테스트 데이터 세트를 반환하는 함수 생성. 사전 데이터 처리가 끝난 뒤 해당 함수 호출
# 사전 데이터 가공 후 학습과 테스트 데이터 세트를 반환하는 함수.
def get_train_test_dataset(df=None):
    # 인자로 입력된 DataFrame의 사전 데이터 가공이 완료된 복사 DataFrame 반환
    df_copy = get_preprocessed_df(df)

    # DataFrame의 맨 마지막 컬럼이 레이블, 나머지는 피처들
    X_features = df_copy.iloc[:, :-1]
    y_target = df_copy.iloc[:, -1]

    # train_test_split( )으로 학습과 테스트 데이터 분할. stratify=y_target으로 Stratified 기반 분할
    X_train, X_test, y_train, y_test = \
    train_test_split(X_features, y_target, test_size=0.3, random_state=0, stratify=y_target)

    # 학습과 테스트 데이터 세트 반환
    return X_train, X_test, y_train, y_test

X_train, X_test, y_train, y_test = get_train_test_dataset(card_df)
print('학습 데이터 레이블 값 비율')
print(y_train.value_counts()/y_train.shape[0] * 100)
print('테스트 데이터 레이블 값 비율')
print(y_test.value_counts()/y_test.shape[0] * 100)


학습 데이터 레이블 값 비율
0    99.827451
1     0.172549
Name: Class, dtype: float64
테스트 데이터 레이블 값 비율
0    99.826785
1     0.173215
Name: Class, dtype: float64
from sklearn.metrics import confusion_matrix, accuracy_score, precision_score, recall_score, f1_score
from sklearn.metrics import roc_auc_score

# 수정된 get_clf_eval() 함수
def get_clf_eval(y_test, pred=None, pred_proba=None):
    confusion = confusion_matrix( y_test, pred)
    accuracy = accuracy_score(y_test , pred)
    precision = precision_score(y_test , pred)
    recall = recall_score(y_test , pred)
    f1 = f1_score(y_test,pred)
    # ROC-AUC 추가
    roc_auc = roc_auc_score(y_test, pred_proba)
    print('오차 행렬')
    print(confusion)
    # ROC-AUC print 추가
    print('정확도: {0:.4f}, 정밀도: {1:.4f}, 재현율: {2:.4f},\
    F1: {3:.4f}, AUC:{4:.4f}'.format(accuracy, precision, recall, f1, roc_auc))
from sklearn.linear_model import LogisticRegression

lr_clf = LogisticRegression()

lr_clf.fit(X_train, y_train)

lr_pred = lr_clf.predict(X_test)
lr_pred_proba = lr_clf.predict_proba(X_test)[:, 1]

# 3장에서 사용한 get_clf_eval() 함수를 이용하여 평가 수행.
get_clf_eval(y_test, lr_pred, lr_pred_proba)


오차 행렬
[[85282    13]
 [   58    90]]
정확도: 0.9992, 정밀도: 0.8738, 재현율: 0.6081,    F1: 0.7171, AUC:0.9709
앞으로 피처 엔지니어링을 수행할 때마다 모델을 학습/예측/평가하므로 이를 위한 함수 생성
# 인자로 사이킷런의 Estimator객체와, 학습/테스트 데이터 세트를 입력 받아서 학습/예측/평가 수행.
def get_model_train_eval(model, ftr_train=None, ftr_test=None, tgt_train=None, tgt_test=None):
    model.fit(ftr_train, tgt_train)
    pred = model.predict(ftr_test)
    pred_proba = model.predict_proba(ftr_test)[:, 1]
    get_clf_eval(tgt_test, pred, pred_proba)
LightGBM 학습/예측/평가
(boost_from_average가 True일 경우 레이블 값이 극도로 불균형 분포를 이루는 경우 재현률 및 ROC-AUC 성능이 매우 저하됨.)
LightGBM 2.1.0 이상 버전에서 이와 같은 현상 발생 defualt가 true가 되면서 오류가 많아짐 // 보통은 좋은데 imbalanced stisfacy에서는 불리
from lightgbm import LGBMClassifier

lgbm_clf = LGBMClassifier(n_estimators=1000, num_leaves=64, n_jobs=-1, boost_from_average=False)
get_model_train_eval(lgbm_clf, ftr_train=X_train, ftr_test=X_test, tgt_train=y_train, tgt_test=y_test)


오차 행렬
[[85289     6]
 [   36   112]]
정확도: 0.9995, 정밀도: 0.9492, 재현율: 0.7568,    F1: 0.8421, AUC:0.9797
중요 데이터 분포도 변환 후 모델 학습/예측/평가
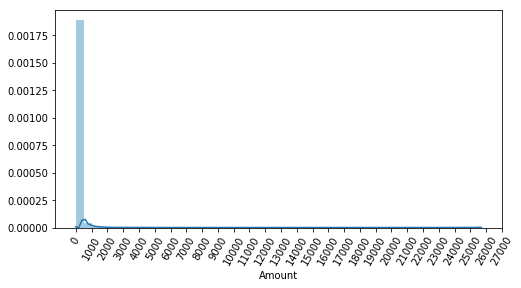
중요 feature의 분포도 확인
import seaborn as sns

plt.figure(figsize=(8, 4))
plt.xticks(range(0, 30000, 1000), rotation=60)
sns.distplot(card_df['Amount'])
데이터 사전 가공을 위한 별도의 함수에 StandardScaler를 이용하여 Amount 피처 변환
from sklearn.preprocessing import StandardScaler

# 사이킷런의 StandardScaler를 이용하여 정규분포 형태로 Amount 피처값 변환하는 로직으로 수정.
def get_preprocessed_df(df=None):
    df_copy = df.copy()
    scaler = StandardScaler()
    amount_n = scaler.fit_transform(df_copy['Amount'].values.reshape(-1, 1))

    # 변환된 Amount를 Amount_Scaled로 피처명 변경후 DataFrame맨 앞 컬럼으로 입력
    df_copy.insert(0, 'Amount_Scaled', amount_n)

    # 기존 Time, Amount 피처 삭제
    df_copy.drop(['Time','Amount'], axis=1, inplace=True)
    return df_copy
StandardScaler 변환 후 로지스틱 회귀 및 LightGBM 학습/예측/평가
# Amount를 정규분포 형태로 변환 후 로지스틱 회귀 및 LightGBM 수행.
X_train, X_test, y_train, y_test = get_train_test_dataset(card_df)

print('### 로지스틱 회귀 예측 성능 ###')
lr_clf = LogisticRegression()
get_model_train_eval(lr_clf, ftr_train=X_train, ftr_test=X_test, tgt_train=y_train, tgt_test=y_test)

print('### LightGBM 예측 성능 ###')
lgbm_clf = LGBMClassifier(n_estimators=1000, num_leaves=64, n_jobs=-1, boost_from_average=False)
get_model_train_eval(lgbm_clf, ftr_train=X_train, ftr_test=X_test, tgt_train=y_train, tgt_test=y_test)


### 로지스틱 회귀 예측 성능 ###
오차 행렬
[[85281    14]
 [   58    90]]
정확도: 0.9992, 정밀도: 0.8654, 재현율: 0.6081,    F1: 0.7143, AUC:0.9707
### LightGBM 예측 성능 ###
오차 행렬
[[85289     6]
 [   36   112]]
정확도: 0.9995, 정밀도: 0.9492, 재현율: 0.7568,    F1: 0.8421, AUC:0.9773
Amount를 로그 변환
def get_preprocessed_df(df=None):
    df_copy = df.copy()
    # 넘파이의 log1p( )를 이용하여 Amount를 로그 변환 // 그냥 log에 +1하면 infini가 0이 됨
    amount_n = np.log1p(df_copy['Amount'])
    df_copy.insert(0, 'Amount_Scaled', amount_n)
    df_copy.drop(['Time','Amount'], axis=1, inplace=True)
    return df_copy
# log1p 와 expm1 설명
import numpy as np

print(1e-1000 == 0.0)

print(np.log(1e-1000))

print(np.log(1e-1000 + 1))
print(np.log1p(1e-1000))

# True
# -inf
# 0.0
# 0.0
var_1 = np.log1p(100)
var_2 = np.expm1(var_1)
print(var_1, var_2)

# 4.61512051684126 100.00000000000003
X_train, X_test, y_train, y_test = get_train_test_dataset(card_df)

print('### 로지스틱 회귀 예측 성능 ###')
get_model_train_eval(lr_clf, ftr_train=X_train, ftr_test=X_test, tgt_train=y_train, tgt_test=y_test)

print('### LightGBM 예측 성능 ###')
get_model_train_eval(lgbm_clf, ftr_train=X_train, ftr_test=X_test, tgt_train=y_train, tgt_test=y_test)

### 로지스틱 회귀 예측 성능 ###
오차 행렬
[[85283    12]
 [   58    90]]
정확도: 0.9992, 정밀도: 0.8824, 재현율: 0.6081,    F1: 0.7200, AUC:0.9721
### LightGBM 예측 성능 ###
오차 행렬
[[85290     5]
 [   35   113]]
정확도: 0.9995, 정밀도: 0.9576, 재현율: 0.7635,    F1: 0.8496, AUC:0.9786
이상치 데이터 제거 후 모델 학습/예측/평가
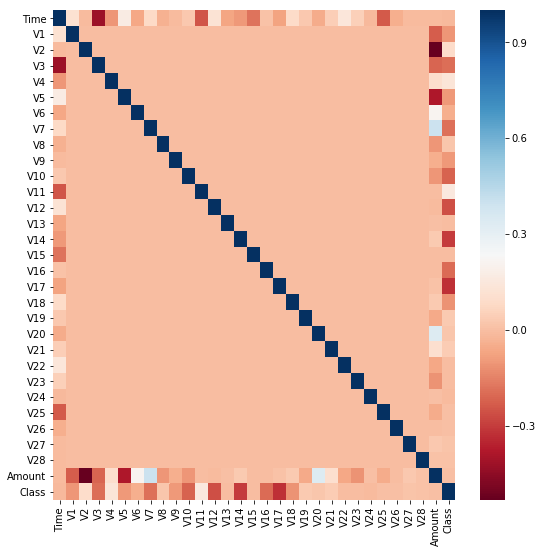
** 각 피처들의 상관 관계를 시각화. 결정 레이블인 class 값과 가장 상관도가 높은 피처 추출 **
import seaborn as sns

plt.figure(figsize=(9, 9))
corr = card_df.corr()
sns.heatmap(corr, cmap='RdBu') # heatmap 가장 높은 상관도를 표시 파란색이 양의 상관관계, 붉은색이 음
# 가운데가 1인 것은 대각선으로 쌍, xy의 시간축이 겹쳐서 당연히 1, class와 상관관계가 높은 것은 v12, 14 등등
Dataframe에서 outlier에 해당하는 데이터를 필터링하기 위한 함수 생성. outlier 레코드의 index를 반환함. ** 이상치 - 최대값 - 3/4 IQR - 2/4 IQR - 1/4 IQR - 최소값 - 이상치
import numpy as np

def get_outlier(df=None, column=None, weight=1.5):
    # fraud에 해당하는 column 데이터만 추출, 1/4 분위와 3/4 분위 지점을 np.percentile로 구함.
    fraud = df[df['Class']==1][column] # 사기인 것만 BOOL 호출
    quantile_25 = np.percentile(fraud.values, 25) # 1분위 25 3분위 75
    quantile_75 = np.percentile(fraud.values, 75)

    # IQR을 구하고, IQR에 1.5를 곱하여 최대값과 최소값 지점 구함.
    iqr = quantile_75 - quantile_25
    iqr_weight = iqr * weight
    lowest_val = quantile_25 - iqr_weight
    highest_val = quantile_75 + iqr_weight

    # 최대값 보다 크거나, 최소값 보다 작은 값을 아웃라이어로 설정하고 DataFrame index 반환.
    outlier_index = fraud[(fraud < lowest_val) | (fraud > highest_val)].index

    return outlier_index
#np.percentile(card_df['V14'].values, 100)
np.max(card_df['V14']) # 같은 계산 결과

# 10.5267660517847
outlier_index = get_outlier(df=card_df, column='V14', weight=1.5)
print('이상치 데이터 인덱스:', outlier_index)
# 이상치가 4개 나옴

# 이상치 데이터 인덱스: Int64Index([8296, 8615, 9035, 9252], dtype='int64')
로그 변환 후 V14 피처의 이상치 데이터를 삭제한 뒤 모델들을 재 학습/예측/평가
# get_processed_df( )를 로그 변환 후 V14 피처의 이상치 데이터를 삭제하는 로직으로 변경.
def get_preprocessed_df(df=None):
    df_copy = df.copy()
    amount_n = np.log1p(df_copy['Amount'])
    df_copy.insert(0, 'Amount_Scaled', amount_n)
    df_copy.drop(['Time','Amount'], axis=1, inplace=True)

    # 이상치 데이터 삭제하는 로직 추가
    outlier_index = get_outlier(df=df_copy, column='V14', weight=1.5)
    df_copy.drop(outlier_index, axis=0, inplace=True) # 행삭제
    return df_copy

X_train, X_test, y_train, y_test = get_train_test_dataset(card_df)

print('### 로지스틱 회귀 예측 성능 ###')
get_model_train_eval(lr_clf, ftr_train=X_train, ftr_test=X_test, tgt_train=y_train, tgt_test=y_test)

print('### LightGBM 예측 성능 ###')
get_model_train_eval(lgbm_clf, ftr_train=X_train, ftr_test=X_test, tgt_train=y_train, tgt_test=y_test)
# 이전에 비해 높아짐


### 로지스틱 회귀 예측 성능 ###
오차 행렬
[[85282    13]
 [   48    98]]
정확도: 0.9993, 정밀도: 0.8829, 재현율: 0.6712,    F1: 0.7626, AUC:0.9747
### LightGBM 예측 성능 ###
오차 행렬
[[85291     4]
 [   25   121]]
정확도: 0.9997, 정밀도: 0.9680, 재현율: 0.8288,    F1: 0.8930, AUC:0.9831
SMOTE 오버 샘플링 적용 후 모델 학습/예측/평가
# conda install -c conda-forge imbalanced-learn
from imblearn.over_sampling import SMOTE

smote = SMOTE(random_state=0)
X_train_over, y_train_over = smote.fit_sample(X_train, y_train)
print('SMOTE 적용 전 학습용 피처/레이블 데이터 세트: ', X_train.shape, y_train.shape)
print('SMOTE 적용 후 학습용 피처/레이블 데이터 세트: ', X_train_over.shape, y_train_over.shape)
print('SMOTE 적용 후 레이블 값 분포: \n', pd.Series(y_train_over).value_counts())


SMOTE 적용 전 학습용 피처/레이블 데이터 세트:  (199362, 29) (199362,)
SMOTE 적용 후 학습용 피처/레이블 데이터 세트:  (398040, 29) (398040,)
SMOTE 적용 후 레이블 값 분포:
 1    199020
0    199020
dtype: int64
y_train.value_counts()

0    199020
1       342
Name: Class, dtype: int64
로지스틱 회귀로 학습/예측/평가
lr_clf = LogisticRegression()
# ftr_train과 tgt_train 인자값이 SMOTE 증식된 X_train_over와 y_train_over로 변경됨에 유의
get_model_train_eval(lr_clf, ftr_train=X_train_over, ftr_test=X_test, tgt_train=y_train_over, tgt_test=y_test)
# 이모델은 정밀도, f1 이 너무 낮아서 적용 불가


오차 행렬
[[82932  2363]
 [   11   135]]
정확도: 0.9722, 정밀도: 0.0540, 재현율: 0.9247,    F1: 0.1021, AUC:0.9737
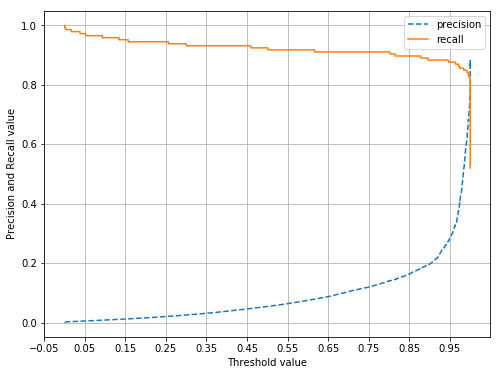
Precision-Recall 곡선 시각화
import matplotlib.pyplot as plt
import matplotlib.ticker as ticker
from sklearn.metrics import precision_recall_curve
%matplotlib inline

def precision_recall_curve_plot(y_test , pred_proba_c1):
    # threshold ndarray와 이 threshold에 따른 정밀도, 재현율 ndarray 추출.
    precisions, recalls, thresholds = precision_recall_curve( y_test, pred_proba_c1)

    # X축을 threshold값으로, Y축은 정밀도, 재현율 값으로 각각 Plot 수행. 정밀도는 점선으로 표시
    plt.figure(figsize=(8,6))
    threshold_boundary = thresholds.shape[0]
    plt.plot(thresholds, precisions[0:threshold_boundary], linestyle='--', label='precision')
    plt.plot(thresholds, recalls[0:threshold_boundary],label='recall')

    # threshold 값 X 축의 Scale을 0.1 단위로 변경
    start, end = plt.xlim()
    plt.xticks(np.round(np.arange(start, end, 0.1),2))

    # x축, y축 label과 legend, 그리고 grid 설정
    plt.xlabel('Threshold value'); plt.ylabel('Precision and Recall value')
    plt.legend(); plt.grid()
    plt.show()
precision_recall_curve_plot( y_test, lr_clf.predict_proba(X_test)[:, 1] )
# 보통 x자인데 너무 불균형함
LightGBM 모델 적용
lgbm_clf = LGBMClassifier(n_estimators=1000, num_leaves=64, n_jobs=-1, boost_from_average=False)
get_model_train_eval(lgbm_clf, ftr_train=X_train_over, ftr_test=X_test,
                  tgt_train=y_train_over, tgt_test=y_test)
# 재현율이 중요하기 때문에 정밀도 조금 떨어뜨리더라도 재현율을 올림


오차 행렬
[[85287     8]
 [   22   124]]
정확도: 0.9996, 정밀도: 0.9394, 재현율: 0.8493, F1: 0.8921, AUC:0.9778'Data_Science > ML_Perfect_Guide' 카테고리의 다른 글
| 5-1. Gradient Descent (0) | 2021.12.27 |
|---|---|
| 4-9. Stacking Ensemble (0) | 2021.12.25 |
| 4-7. 산탄데르 고객 만족 예측 || XGBoost, LightGBM (0) | 2021.12.25 |
| 4.6 LightGBM || 유방암 예측 (0) | 2021.12.23 |
| 4-5. XGBoost(eXtra Gradient Boost) (0) | 2021.12.23 |