728x90
반응형
KDE(Kernel Density Estimation)의 이해
seaborn의 distplot()을 이용하여 KDE 시각화
https://seaborn.pydata.org/tutorial/distributions.html
import numpy as np
import seaborn as sns
import matplotlib.pyplot as plt
%matplotlib inline

sns.set(color_codes=True)

np.random.seed(0)
x = np.random.normal(0, 1, size=30)
print(x)
sns.distplot(x);
# HIST 막대그램, KDE 분포그래프 RUG 밀집도


[ 1.76405235  0.40015721  0.97873798  2.2408932   1.86755799 -0.97727788
  0.95008842 -0.15135721 -0.10321885  0.4105985   0.14404357  1.45427351
  0.76103773  0.12167502  0.44386323  0.33367433  1.49407907 -0.20515826
  0.3130677  -0.85409574 -2.55298982  0.6536186   0.8644362  -0.74216502
  2.26975462 -1.45436567  0.04575852 -0.18718385  1.53277921  1.46935877]
sns.distplot(x, rug=True)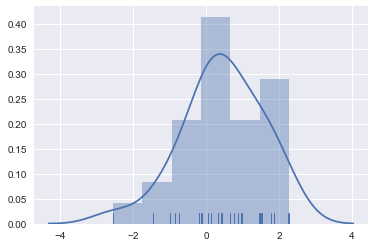
sns.distplot(x, kde=False, rug=True)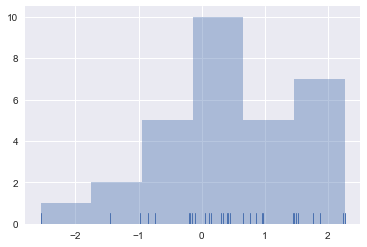
sns.distplot(x, hist=False, rug=True);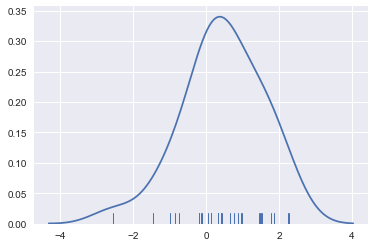
개별 관측데이터에 대해 가우시안 커널 함수를 적용
from scipy import stats

#x = np.random.normal(0, 1, size=30) # 샘플데이터
bandwidth = 1.06 * x.std() * x.size ** (-1 / 5.) # 커널함수 만들기
support = np.linspace(-4, 4, 200)     # -4~4까지 200개로 촘촘히 표현

kernels = []
for x_i in x:
    kernel = stats.norm(x_i, bandwidth).pdf(support)
    kernels.append(kernel) # 커널함수를 각각 그릴것
    plt.plot(support, kernel, color="r")

sns.rugplot(x, color=".2", linewidth=3);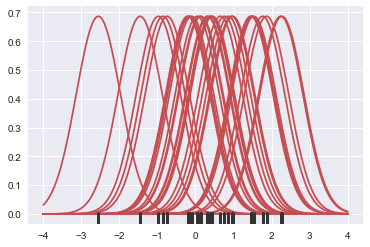
from scipy.integrate import trapz
density = np.sum(kernels, axis=0)
density /= trapz(density, support)
plt.plot(support, density);
seaborn은 kdeplot()으로 kde곡선을 바로 구할 수 있음
sns.kdeplot(x, shade=True);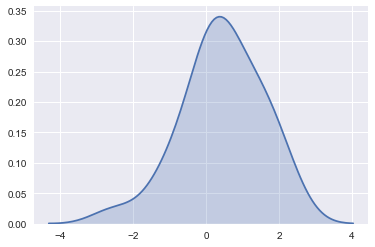
bandwidth에 따른 KDE 변화
sns.kdeplot(x)
sns.kdeplot(x, bw=.2, label="bw: 0.2") # 작고
sns.kdeplot(x, bw=2, label="bw: 2") # 크게
plt.legend();
반응형
'Data_Science > ML_Perfect_Guide' 카테고리의 다른 글
| 7-7. Gaussian_Mixture_Model (0) | 2021.12.30 |
|---|---|
| 7-6. Mean_Shift (0) | 2021.12.30 |
| 7-3. Cluster_evaluation || 실루엣 계수 (0) | 2021.12.30 |
| 7-2. Kmeans 2 (0) | 2021.12.29 |
| 7-1. Kmeans (0) | 2021.12.29 |