728x90
반응형
import csv
import pandas as pd

df = pd.read_csv('auto-mpg.csv', header=None)
df.columns = ['mpg','cylinders','displacemente','horepower',\
              'weight','acceleratoin','modelyear','origin','name']
print(df.head())

    mpg  cylinders  displacemente horepower  weight  acceleratoin  modelyear  \
0  18.0          8          307.0     130.0  3504.0          12.0         70
1  15.0          8          350.0     165.0  3693.0          11.5         70
2  18.0          8          318.0     150.0  3436.0          11.0         70
3  16.0          8          304.0     150.0  3433.0          12.0         70
4  17.0          8          302.0     140.0  3449.0          10.5         70

   origin                       name
0       1  chevrolet chevelle malibu
1       1          buick skylark 320
2       1         plymouth satellite
3       1              amc rebel sst
4       1                ford torino
print(df.corr())
mpg cylinders displacemente weight acceleratoin \
mpg 1.000000 -0.775396 -0.804203 -0.831741 0.420289
cylinders -0.775396 1.000000 0.950721 0.896017 -0.505419
displacemente -0.804203 0.950721 1.000000 0.932824 -0.543684
weight -0.831741 0.896017 0.932824 1.000000 -0.417457
acceleratoin 0.420289 -0.505419 -0.543684 -0.417457 1.000000
modelyear 0.579267 -0.348746 -0.370164 -0.306564 0.288137
origin 0.563450 -0.562543 -0.609409 -0.581024 0.205873
modelyear origin
mpg 0.579267 0.563450
cylinders -0.348746 -0.562543
displacemente -0.370164 -0.609409
weight -0.306564 -0.581024
acceleratoin 0.288137 0.205873
modelyear 1.000000 0.180662
origin 0.180662 1.000000print(df[['mpg','weight']].corr())
mpg weight
mpg 1.000000 -0.831741
weight -0.831741 1.000000df.plot(x='weight', y='mpg', kind='scatter')
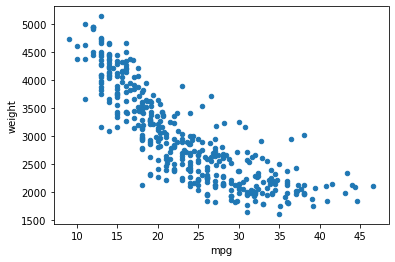
df.plot(x='mpg', y='weight', kind='scatter')
df[['mpg', 'cylinders']].plot(kind='box')
반응형
'Data_Science > Data_Analysis_Py' 카테고리의 다른 글
| 6. Titanic || '21.06.24. (0) | 2021.10.26 |
|---|---|
| 5. auto-mpg 분석 || '21.06.24. (0) | 2021.10.26 |
| 4. 시도별 전출입 인구수 분석 ( 2 || '21.06.24. (0) | 2021.10.26 |
| 3. 시도별 전출입 인구수 분석 ( 1 || 2021.06.23 (0) | 2021.10.26 |
| 1. 남북한발전전력량 분석 || 2021.06.24 (0) | 2021.10.19 |