728x90
반응형
# 비지도 학습 : 데이터셋 내부에 정답 없음
관측값을 몇개의 집단으로 나눔. 정답이 없는 상태에서 데이터의 유사성으로 판단 => 군집
군집 : kmeans : 데이터간의 유사성을 측정하는 기준으로 클러스터의 중심까지의 거리 이용.
import pandas as pd
import matplotlib.pyplot as plt
# 고객의 연간 구매금액을 상품카테고리별로 구분한 데이ㅓ
uci_path = 'https://archive.ics.uci.edu/ml/machine-learning-databases/\
00292/Wholesale%20customers%20data.csv'
df = pd.read_csv(uci_path, header = 0)
df.head()

	Channel	Region	Fresh	Milk	Grocery	Frozen	Detergents_Paper	Delicassen
0	2	3	12669	9656	7561	214	2674	1338
1	2	3	7057	9810	9568	1762	3293	1776
2	2	3	6353	8808	7684	2405	3516	7844
3	1	3	13265	1196	4221	6404	507	1788
4	2	3	22615	5410	7198	3915	1777	5185
df.info()

<class 'pandas.core.frame.DataFrame'>
RangeIndex: 440 entries, 0 to 439
Data columns (total 8 columns):
 #   Column            Non-Null Count  Dtype
---  ------            --------------  -----
 0   Channel           440 non-null    int64
 1   Region            440 non-null    int64
 2   Fresh             440 non-null    int64
 3   Milk              440 non-null    int64
 4   Grocery           440 non-null    int64
 5   Frozen            440 non-null    int64
 6   Detergents_Paper  440 non-null    int64
 7   Delicassen        440 non-null    int64
dtypes: int64(8)
memory usage: 27.6 KB
x = df.iloc[:,:]
# 정규화
from sklearn import preprocessing
x = preprocessing.StandardScaler().fit(x).transform(x)
x[:5]

array([[ 1.44865163,  0.59066829,  0.05293319,  0.52356777, -0.04111489,
        -0.58936716, -0.04356873, -0.06633906],
       [ 1.44865163,  0.59066829, -0.39130197,  0.54445767,  0.17031835,
        -0.27013618,  0.08640684,  0.08915105],
       [ 1.44865163,  0.59066829, -0.44702926,  0.40853771, -0.0281571 ,
        -0.13753572,  0.13323164,  2.24329255],
       [-0.69029709,  0.59066829,  0.10011141, -0.62401993, -0.3929769 ,
         0.6871443 , -0.49858822,  0.09341105],
       [ 1.44865163,  0.59066829,  0.84023948, -0.05239645, -0.07935618,
         0.17385884, -0.23191782,  1.29934689]])
from sklearn import cluster
kms = cluster.KMeans(init = 'k-means++', n_clusters=5, n_init=10)
# init = kmeans++ 중심점 설정없이 최초설정
# n clusters 5종류의 클러스터로 설정
# n_init 10개로 시작
kms.fit(x)
cluster_label= kms.labels_
print(cluster_label)

[3 3 3 1 3 3 3 3 1 3 3 3 3 3 3 1 3 1 3 1 3 1 1 2 3 3 1 1 3 1 1 1 1 1 1 3 1
 3 3 1 1 1 3 3 3 3 3 4 3 3 1 1 3 3 1 1 4 3 1 1 3 4 3 3 1 4 1 3 1 1 1 2 1 3
 3 1 1 3 1 1 1 3 3 1 3 4 4 2 1 1 1 1 4 1 3 1 3 1 1 1 3 3 3 1 1 1 3 3 3 3 1
 3 1 1 1 1 1 1 1 1 1 1 1 3 1 1 1 3 1 1 1 1 1 1 1 1 1 1 1 1 1 1 1 1 1 3 1 1
 1 1 1 1 1 1 1 3 3 1 3 3 3 1 1 3 3 3 3 1 1 1 3 3 1 3 1 3 1 1 1 1 1 2 1 2 1
 1 1 1 3 3 1 1 1 3 1 1 0 3 0 0 3 3 0 0 0 3 0 0 0 3 0 4 0 0 3 0 3 0 3 0 0 0
 0 0 0 0 0 0 0 0 0 0 0 0 0 0 0 0 0 0 0 0 0 0 0 3 0 0 0 0 0 4 0 0 0 0 0 0 0
 0 0 0 0 0 3 0 3 0 3 0 0 0 0 1 1 1 1 1 1 3 1 3 1 1 1 1 1 1 1 1 1 1 1 3 0 3
 0 3 3 0 3 3 3 3 3 3 3 0 0 3 0 0 3 0 0 3 0 0 0 3 0 0 0 0 0 2 0 0 0 0 0 3 0
 4 0 3 0 0 0 0 3 3 1 3 1 1 3 3 1 3 1 3 1 3 1 1 1 3 1 1 1 1 1 1 1 3 1 1 1 1
 3 1 1 3 1 1 3 1 1 3 1 1 1 1 1 1 1 1 1 1 1 1 1 1 1 1 3 1 1 1 1 1 1 1 1 1 1
 3 3 1 1 1 1 1 1 3 3 1 3 1 1 3 1 3 3 1 1 1 1 1 1 1 1 1 1 1 1 3 1 1]
df['Cluster'] = cluster_label
df.head()

	Channel	Region	Fresh	Milk	Grocery	Frozen	Detergents_Paper	Delicassen	Cluster
0	2	3	12669	9656	7561	214	2674	1338	3
1	2	3	7057	9810	9568	1762	3293	1776	3
2	2	3	6353	8808	7684	2405	3516	7844	3
3	1	3	13265	1196	4221	6404	507	1788	1
4	2	3	22615	5410	7198	3915	1777	5185	3
df.plot(kind = 'scatter', x ='Grocery', y = 'Frozen', c = 'Cluster', cmap = 'Set1', colorbar=False, figsize=(10,10))
df.plot(kind = 'scatter', x ='Milk', y = 'Delicassen', c = 'Cluster', cmap = 'Set1', colorbar=True, figsize=(10,10))
plt.show()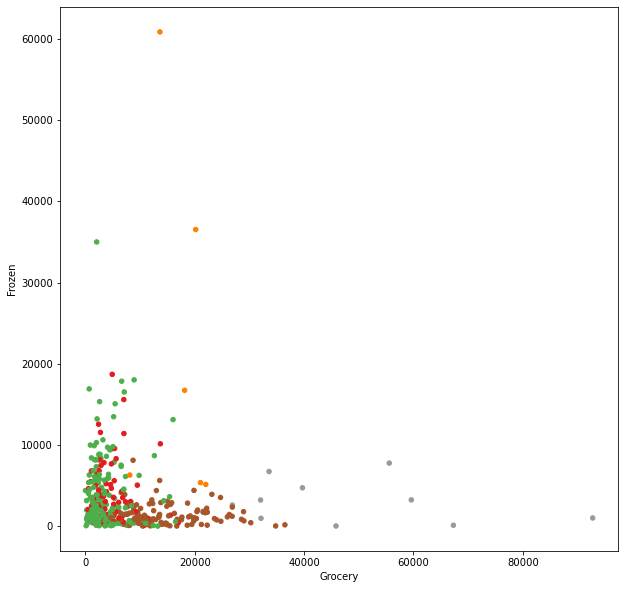

반응형
'Data_Science > Data_Analysis_Py' 카테고리의 다른 글
| 27. 프로야구 연봉 예측 분석 || OLS, Heatmap (0) | 2021.11.24 |
|---|---|
| 26. 서울 중학교 졸업자 분석 || dbscan, folium (0) | 2021.11.24 |
| 24. 위스콘신 유방안데이터 분석 || DT (0) | 2021.11.24 |
| 23. titanic 분류 예측 | KNN, SVM (0) | 2021.11.24 |
| 22. auto-mpg || 회귀분석 (0) | 2021.11.24 |