728x90
반응형
import pandas as pd
import numpy as np
import matplotlib.pyplot as plt
import seaborn as sns
df = pd.read_csv('seoul_5.csv', encoding = 'cp949')
df.info()

<class 'pandas.core.frame.DataFrame'>
RangeIndex: 40221 entries, 0 to 40220
Data columns (total 5 columns):
 #   Column   Non-Null Count  Dtype
---  ------   --------------  -----
 0   날짜       40221 non-null  object
 1   지점       40221 non-null  int64
 2   평균기온(℃)  39465 non-null  float64
 3   최저기온(℃)  39464 non-null  float64
 4   최고기온(℃)  39463 non-null  float64
dtypes: float64(3), int64(1), object(1)
memory usage: 1.5+ MB
df.describe()
지점 평균기온(℃) 최저기온(℃) 최고기온(℃)
count 40221.0 39465.000000 39464.000000 39463.000000
mean 108.0 11.704019 7.406393 16.716083
std 0.0 10.668056 10.891154 10.998383
min 108.0 -19.200000 -23.100000 -16.300000
25% 108.0 2.600000 -1.500000 7.200000
50% 108.0 12.900000 8.000000 18.600000
75% 108.0 21.200000 17.000000 26.200000
max 108.0 33.700000 30.300000 39.600000df
날짜 지점 평균기온(℃) 최저기온(℃) 최고기온(℃)
0 1907-10-01 108 13.5 7.9 20.7
1 1907-10-02 108 16.2 7.9 22.0
2 1907-10-03 108 16.2 13.1 21.3
3 1907-10-04 108 16.5 11.2 22.0
4 1907-10-05 108 17.6 10.9 25.4
... ... ... ... ... ...
40216 2019-01-13 108 1.2 -3.0 7.6
40217 2019-01-14 108 1.4 -2.4 5.3
40218 2019-01-15 108 -1.7 -7.2 2.6
40219 2019-01-16 108 -5.2 -10.1 -1.1
40220 2019-01-17 108 -0.3 -3.2 4.0# 결측치 제거
# 날짜 dateTime => 월일 잘라내기
df['날짜'] = pd.to_datetime(df['날짜'])
df.info()
<class 'pandas.core.frame.DataFrame'>
RangeIndex: 40221 entries, 0 to 40220
Data columns (total 5 columns):
# Column Non-Null Count Dtype
--- ------ -------------- -----
0 날짜 40221 non-null datetime64[ns]
1 지점 40221 non-null int64
2 평균기온(℃) 39465 non-null float64
3 최저기온(℃) 39464 non-null float64
4 최고기온(℃) 39463 non-null float64
dtypes: datetime64[ns](1), float64(3), int64(1)
memory usage: 1.5 MBdf['Year'] = df['날짜'].dt.year
df['Month'] = df['날짜'].dt.month
df['Day'] = df['날짜'].dt.day
df.head()
날짜 지점 평균기온(℃) 최저기온(℃) 최고기온(℃) Year Month Day
0 1907-10-01 108 13.5 7.9 20.7 1907 10 1
1 1907-10-02 108 16.2 7.9 22.0 1907 10 2
2 1907-10-03 108 16.2 13.1 21.3 1907 10 3
3 1907-10-04 108 16.5 11.2 22.0 1907 10 4
4 1907-10-05 108 17.6 10.9 25.4 1907 10 5df.columns = ['날짜','지점','평균기온','최저기온','최고기온','Year','Month','Day']
df.head()

	날짜	지점	평균기온	최저기온	최고기온	Year	Month	Day
0	1907-10-01	108	13.5	7.9	20.7	1907	10	1
1	1907-10-02	108	16.2	7.9	22.0	1907	10	2
2	1907-10-03	108	16.2	13.1	21.3	1907	10	3
3	1907-10-04	108	16.5	11.2	22.0	1907	10	4
4 1907-10-05 108 17.6 10.9 25.4 1907 10 5df_0214 = df[(df['Month'] == 2)&(df['Day'] == 14)]
df_0214
날짜 지점 평균기온 최저기온 최고기온 Year Month Day
136 1908-02-14 108 -3.3 -7.5 2.3 1908 2 14
502 1909-02-14 108 2.6 -4.5 8.8 1909 2 14
867 1910-02-14 108 -3.1 -10.1 2.8 1910 2 14
1232 1911-02-14 108 0.8 0.0 3.5 1911 2 14
1597 1912-02-14 108 6.3 0.9 11.2 1912 2 14
... ... ... ... ... ... ... ... ...
38422 2014-02-14 108 2.7 -0.7 7.6 2014 2 14
38787 2015-02-14 108 2.0 -3.1 6.6 2015 2 14
39152 2016-02-14 108 -2.6 -6.8 5.8 2016 2 14
39518 2017-02-14 108 0.3 -4.0 6.5 2017 2 14
39883 2018-02-14 108 3.5 -0.7 8.7 2018 2 14
110 rows × 8 columnsdf_year = df_0214['Year']
df_high = df_0214['최고기온']
df_low = df_0214['최저기온']plt.style.use('ggplot')
fig = plt.figure(figsize=(20,5))
ax = fig.add_subplot(1,1,1)
ax.plot(df_year, df_0214['최고기온'], label = df['날짜'])
ax.plot(df_year, df_0214['최저기온'])
ax.set_title('2월 14일 기온 변화')
ax.set_xticklabels(df['Year'], rotation = 90)
ax.set_xlabel('year')
ax.set_ylabel('temperture')
plt.show()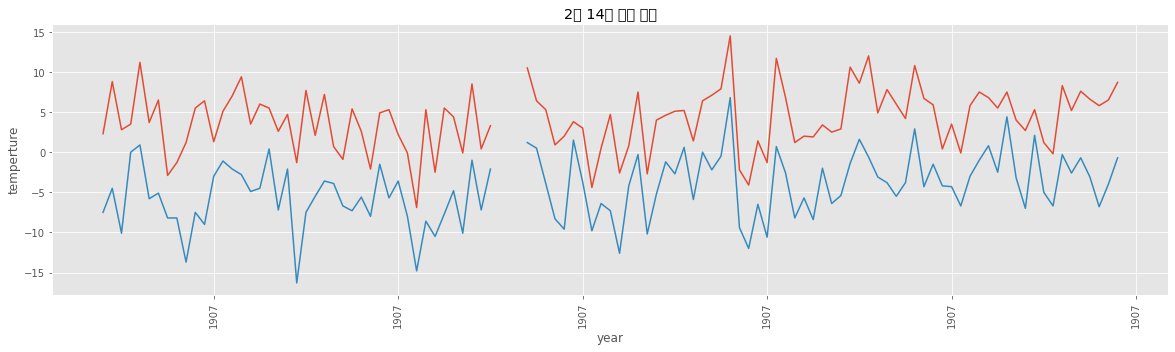
df.head()
날짜 지점 평균기온 최저기온 최고기온 Year Month Day
0 1907-10-01 108 13.5 7.9 20.7 1907 10 1
1 1907-10-02 108 16.2 7.9 22.0 1907 10 2
2 1907-10-03 108 16.2 13.1 21.3 1907 10 3
3 1907-10-04 108 16.5 11.2 22.0 1907 10 4
4 1907-10-05 108 17.6 10.9 25.4 1907 10 5plt.style.use('ggplot')
plt.hist(df['평균기온'], bins = 100, color = 'r')
plt.show()
df.isnull().sum()

날짜         0
지점         0
평균기온     756
최저기온     757
최고기온     758
Year       0
Month      0
Day        0
dtype: int64
df = df.dropna(axis=0, how='any', thresh=None, subset=None, inplace=False)
df.isnull().sum()
날짜 0
지점 0
평균기온 0
최저기온 0
최고기온 0
Year 0
Month 0
Day 0
dtype: int64df.info()
<class 'pandas.core.frame.DataFrame'>
Int64Index: 39463 entries, 0 to 40220
Data columns (total 8 columns):
# Column Non-Null Count Dtype
--- ------ -------------- -----
0 날짜 39463 non-null datetime64[ns]
1 지점 39463 non-null int64
2 평균기온 39463 non-null float64
3 최저기온 39463 non-null float64
4 최고기온 39463 non-null float64
5 Year 39463 non-null int64
6 Month 39463 non-null int64
7 Day 39463 non-null int64
dtypes: datetime64[ns](1), float64(3), int64(4)
memory usage: 2.7 MBplt.style.use('ggplot')
plt.boxplot(df['평균기온'])
plt.title("1907년부터 2019년까지 서울의 평균기온")
# Text(0.5, 1.0, '1907년부터 2019년까지 서울의 평균기온')
반응형
'Data_Science > Data_Analysis_Py' 카테고리의 다른 글
| 19. 세계음주데이터2 (0) | 2021.11.23 |
|---|---|
| 18. 세계음주 데이터 분석 (0) | 2021.11.03 |
| 16. EDA, 멕시코식당 주문 CHIPOTLE (0) | 2021.10.28 |
| 15. 스크래핑 (0) | 2021.10.28 |
| 14. Stockprice (2 (0) | 2021.10.26 |