728x90
반응형
from scipy import stats
import pandas as pd
drinks = pd.read_csv('drinks.csv')
drinks['continent'] = drinks['continent'].fillna('OT')
drinks.info

<bound method DataFrame.info of          country  beer_servings  spirit_servings  wine_servings  \
0    Afghanistan              0                0              0
1        Albania             89              132             54
2        Algeria             25                0             14
3        Andorra            245              138            312
4         Angola            217               57             45
..           ...            ...              ...            ...
188    Venezuela            333              100              3
189      Vietnam            111                2              1
190        Yemen              6                0              0
191       Zambia             32               19              4
192     Zimbabwe             64               18              4

     total_litres_of_pure_alcohol continent
0                             0.0        AS
1                             4.9        EU
2                             0.7        AF
3                            12.4        EU
4                             5.9        AF
..                            ...       ...
188                           7.7        SA
189                           2.0        AS
190                           0.1        AS
191                           2.5        AF
192                           4.7        AF

[193 rows x 6 columns]>
africa = drinks.loc[drinks['continent']=='AF']
europe = drinks.loc[drinks['continent']=='EU']
# 두집단간 평균의 차이
tTestResult = stats.ttest_ind(africa['beer_servings'], europe['beer_servings'])
tTestResultDiffVar = stats.ttest_ind(africa['beer_servings'], europe['beer_servings'], equal_var = False)
# 두집단의 분산이 같다 가설
print(tTestResult)

# Ttest_indResult(statistic=-7.267986335644365, pvalue=9.719556422442453e-11)
# 두집단의 분산이 다르다 가설
print(tTestResultDiffVar)

# Ttest_indResult(statistic=-7.143520192189803, pvalue=2.9837787864303205e-10)
- t-statistic : 평균차이, 음수 : 뒤쪽 데이터의 평균 큰 경우, 검정 통계
- p-value : 유의확률, 결과가 0, 두집단의 평균이 같지 않다. => 귀무가설이 기각, 맞다틀리다
- 귀무가설 : 현재가설이 맞지 않다를 증명 // 예상되는 가설
- 대립가설 : 귀무가설의 반대되는 가설,
- 아프리카와 유럽의 맥주소비량의 차이는 확률적으로 다르다
- => 통계적으로 유의미하다
# 대한민국은 얼마나 술을 독하게 마실까?
drinks['total_servings'] =  drinks['beer_servings'] + drinks['spirit_servings']+drinks['wine_servings']
drinks.head()

	country	beer_servings	spirit_servings	wine_servings	total_litres_of_pure_alcohol	continent	total_servings
0	Afghanistan	0	0	0	0.0	AS	0
1	Albania	89	132	54	4.9	EU	275
2	Algeria	25	0	14	0.7	AF	39
3	Andorra	245	138	312	12.4	EU	695
4	Angola	217	57	45	5.9	AF	319
drinks['alcohol_rate'] = drinks['total_litres_of_pure_alcohol'] / drinks['total_servings']
# alcohol rate , 분모가 0이면 결측값이 생김
drinks.info()

<class 'pandas.core.frame.DataFrame'>
RangeIndex: 193 entries, 0 to 192
Data columns (total 8 columns):
 #   Column                        Non-Null Count  Dtype
---  ------                        --------------  -----
 0   country                       193 non-null    object
 1   beer_servings                 193 non-null    int64
 2   spirit_servings               193 non-null    int64
 3   wine_servings                 193 non-null    int64
 4   total_litres_of_pure_alcohol  193 non-null    float64
 5   continent                     193 non-null    object
 6   total_servings                193 non-null    int64
 7   alcohol_rate                  180 non-null    float64
dtypes: float64(2), int64(4), object(2)
memory usage: 12.2+ KB
drinks['alcohol_rate'].fillna(0, inplace = True)
drinks.info()

<class 'pandas.core.frame.DataFrame'>
RangeIndex: 193 entries, 0 to 192
Data columns (total 8 columns):
 #   Column                        Non-Null Count  Dtype
---  ------                        --------------  -----
 0   country                       193 non-null    object
 1   beer_servings                 193 non-null    int64
 2   spirit_servings               193 non-null    int64
 3   wine_servings                 193 non-null    int64
 4   total_litres_of_pure_alcohol  193 non-null    float64
 5   continent                     193 non-null    object
 6   total_servings                193 non-null    int64
 7   alcohol_rate                  193 non-null    float64
dtypes: float64(2), int64(4), object(2)
memory usage: 12.2+ KB
country_alcohol_rank = drinks[['country', 'alcohol_rate']]
country_alcohol_rank = country_alcohol_rank.sort_values(by = ['alcohol_rate'], ascending = False)
country_alcohol_rank.head()

	country	alcohol_rate
63	Gambia	0.266667
153	Sierra Leone	0.223333
124	Nigeria	0.185714
179	Uganda	0.153704
142	Rwanda	0.151111
import numpy as np
import matplotlib.pyplot as plt
country_list = country_alcohol_rank.country.tolist()
x_pos = np.arange(len(country_list))
rank = country_alcohol_rank.alcohol_rate.tolist()
country_list.index("South Korea")

bar_list = plt.bar(x_pos, rank)
bar_list[country_list.index('South Korea')].set_color('r')
plt.ylabel('alcohol rate')
plt.title('liquor drink rank by country')
plt.axis([0, 200, 0, 0.3])

korea_rank = country_list.index('South Korea')
korea_alc_rate = country_alcohol_rank[country_alcohol_rank['country'] == 'South Korea']['alcohol_rate'].values[0]
plt.annotate('South korea :' + str(korea_rank + 1), xy = (korea_rank, korea_alc_rate),
            xytext = (korea_rank + 10, korea_alc_rate + 0.05),
            arrowprops = dict(facecolor = 'red', shrink = 0.05))
plt.show()
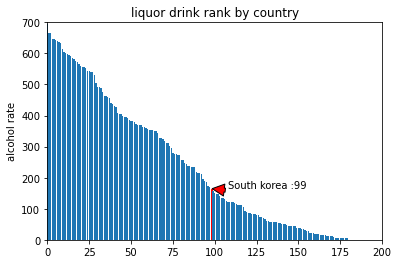
#  전체 소비량을 막대그래프로 작성
country_serving_rank = drinks[['country','total_servings']]
country_serving_rank = country_serving_rank.sort_values(by=['total_servings'], ascending=0)
country_serving_rank.head()

	country	total_servings
3	Andorra	695
68	Grenada	665
45	Czech Republic	665
61	France	648
141	Russian Federation	646
# 그래프 작성하기
country_list = country_serving_rank.country.tolist()
x_pos = np.arange(len(country_list))
rank = country_serving_rank.total_servings.tolist()

bar_list = plt.bar(x_pos, rank)
bar_list[country_list.index('South Korea')].set_color('r')
plt.ylabel('alcohol rate')
plt.title('liquor drink rank by country')
plt.axis([0, 200, 0, 700])

korea_rank = country_list.index('South Korea')
korea_serving_rate = country_serving_rank[country_serving_rank['country'] == 'South Korea']['total_servings'].values[0]
plt.annotate('South korea :' + str(korea_rank + 1), xy = (korea_rank, korea_serving_rate),
            xytext = (korea_rank + 10, korea_serving_rate + 0.05),
            arrowprops = dict(facecolor = 'red', shrink = 0.05))
plt.show()
반응형
'Data_Science > Data_Analysis_Py' 카테고리의 다른 글
| 21. 서울시 범죄율 분석 || MinMaxscalimg (0) | 2021.11.24 |
|---|---|
| 20. 서울시 인구분석 || 다중회귀 (0) | 2021.11.23 |
| 18. 세계음주 데이터 분석 (0) | 2021.11.03 |
| 17. 서울 기온 분석 (0) | 2021.11.02 |
| 16. EDA, 멕시코식당 주문 CHIPOTLE (0) | 2021.10.28 |