728x90
반응형
# 보스턴 주택가격정보
# http://lib.stat.cmu.edu/datasets/boston_correted.txt
BostonHousing2.csv
0.05MB
import pandas as pd import numpy as np import matplotlib.pyplot as plt import seaborn as sns housing = pd.read_csv('BostonHousing2.csv') housing.head() TOWN LON LAT CMEDV CRIM ZN INDUS CHAS NOX RM AGE DIS RAD TAX PTRATIO B LSTAT 0 Nahant -70.955 42.2550 24.0 0.00632 18.0 2.31 0 0.538 6.575 65.2 4.0900 1 296 15.3 396.90 4.98 1 Swampscott -70.950 42.2875 21.6 0.02731 0.0 7.07 0 0.469 6.421 78.9 4.9671 2 242 17.8 396.90 9.14 2 Swampscott -70.936 42.2830 34.7 0.02729 0.0 7.07 0 0.469 7.185 61.1 4.9671 2 242 17.8 392.83 4.03 3 Marblehead -70.928 42.2930 33.4 0.03237 0.0 2.18 0 0.458 6.998 45.8 6.0622 3 222 18.7 394.63 2.94 4 Marblehead -70.922 42.2980 36.2 0.06905 0.0 2.18 0 0.458 7.147 54.2 6.0622 3 222 18.7 396.90 5.33
housing = housing.rename(columns = {'CMEDV':'y'}) housing.info() <class 'pandas.core.frame.DataFrame'> RangeIndex: 506 entries, 0 to 505 Data columns (total 17 columns): # Column Non-Null Count Dtype --- ------ -------------- ----- 0 TOWN 506 non-null object 1 LON 506 non-null float64 2 LAT 506 non-null float64 3 y 506 non-null float64 4 CRIM 506 non-null float64 5 ZN 506 non-null float64 6 INDUS 506 non-null float64 7 CHAS 506 non-null int64 8 NOX 506 non-null float64 9 RM 506 non-null float64 10 AGE 506 non-null float64 11 DIS 506 non-null float64 12 RAD 506 non-null int64 13 TAX 506 non-null int64 14 PTRATIO 506 non-null float64 15 B 506 non-null float64 16 LSTAT 506 non-null float64 dtypes: float64(13), int64(3), object(1) memory usage: 67.3+ KB
import seaborn as sns cols = ['y','RM','LSTAT','NOX'] sns.pairplot( housing[cols]) plt.show() # y, RM 양의 상관관계, LSTAT, NOX 음의 상관관계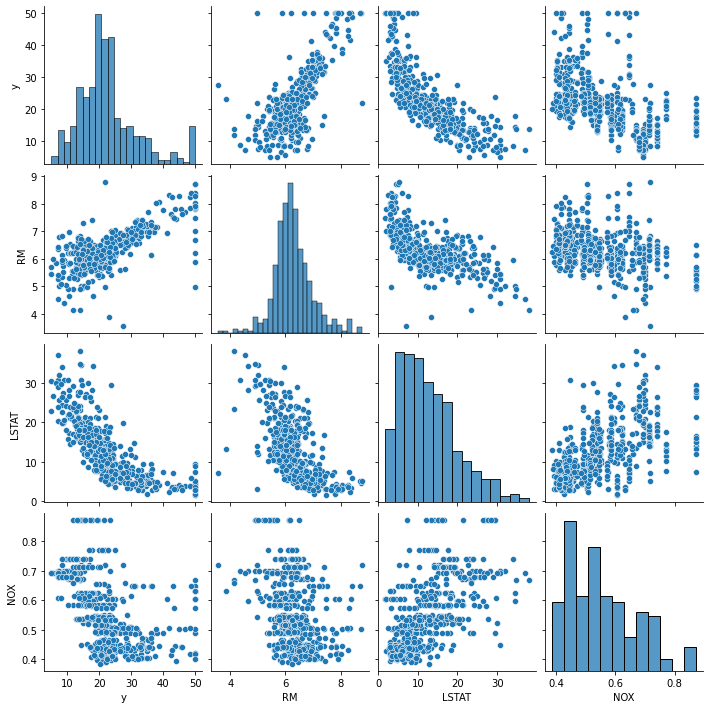
# 독립속성, 종속속성 선택 y = housing['y']from sklearn import linear_model from sklearn.model_selection import train_test_split from sklearn.metrics import mean_squared_error from math import sqrt #1 독립속성 선택 x = housing[['CRIM','ZN','INDUS','CHAS','NOX','RM','AGE', 'DIS','RAD','TAX','PTRATIO','B','LSTAT']] # 2 종속속성 선택 y = housing['y'] x_train, x_test, y_train, y_test = train_test_split(x, y, test_size=0.2, random_state=33)
lr = linear_model.LinearRegression() model = lr.fit(x_train, y_train) print(model.score(x_train, y_train)) print(model.score(x_test, y_test)) 0.7490284664199387 0.7009342135321538
print(lr.coef_) [-1.11193551e-01 5.09415195e-02 3.25436161e-02 3.02115825e+00 -1.54108556e+01 4.04590890e+00 -1.97595267e-03 -1.56114408e+00 3.27038718e-01 -1.38825230e-02 -8.22151628e-01 8.74659468e-03 -5.85060261e-01]
y_pred = lr.predict(x_train) rmse = sqrt(mean_squared_error(y_train, y_pred)) print(rmse) 4.672162734008588
y_pred = lr.predict(x_test) rmse = sqrt(mean_squared_error(y_test, y_pred)) print(rmse) 4.614951784913319
y[:10] 0 24.0 1 21.6 2 34.7 3 33.4 4 36.2 5 28.7 6 22.9 7 22.1 8 16.5 9 18.9 Name: y, dtype: float64반응형
'Data_Science > Data_Analysis_Py' 카테고리의 다른 글
| 32. titanic || GBM (0) | 2021.11.24 |
|---|---|
| 31. titanic || logistic (0) | 2021.11.24 |
| 29. 비트코인 시계열 분석 || prophet (0) | 2021.11.24 |
| 28. 비트코인 가격 시계열 분석 || Arima, fbProphet (0) | 2021.11.24 |
| 27. 프로야구 연봉 예측 분석 || OLS, Heatmap (0) | 2021.11.24 |