728x90
반응형
01. CCTV_in_Seoul
0.00MB
import pandas as pd cctv_seoul = pd.read_csv('01. CCTV_in_Seoul.csv', encoding = 'utf-8') cctv_seoul.rename(columns ={'기관명':'구별'}, inplace = True) cctv_seoul 구별 소계 2013년도 이전 2014년 2015년 2016년 0 강남구 2780 1292 430 584 932 1 강동구 773 379 99 155 377 2 강북구 748 369 120 138 204 3 강서구 884 388 258 184 81 4 관악구 1496 846 260 390 613 5 광진구 707 573 78 53 174 6 구로구 1561 1142 173 246 323 7 금천구 1015 674 51 269 354 8 노원구 1265 542 57 451 516 9 도봉구 485 238 159 42 386 10 동대문구 1294 1070 23 198 579 11 동작구 1091 544 341 103 314 12 마포구 574 314 118 169 379 13 서대문구 962 844 50 68 292 14 서초구 1930 1406 157 336 398 15 성동구 1062 730 91 241 265 16 성북구 1464 1009 78 360 204 17 송파구 618 529 21 68 463 18 양천구 2034 1843 142 30 467 19 영등포구 904 495 214 195 373 20 용산구 1624 1368 218 112 398 21 은평구 1873 1138 224 278 468 22 종로구 1002 464 314 211 630 23 중구 671 413 190 72 348 24 중랑구 660 509 121 177 109
pop_seoul = pd.read_excel('01. population_in_Seoul.xls', header = 2, usecols = 'B, D, G, J, N') pop_seoul.rename(columns = {pop_seoul.columns[0]:'구별', pop_seoul.columns[1]:'인구수', pop_seoul.columns[2]:'한국인', pop_seoul.columns[3]:'외국인', pop_seoul.columns[4]:'고령자'}, inplace = True) pop_seoul.head() 구별 인구수 한국인 외국인 고령자 0 합계 10197604.0 9926968.0 270636.0 1321458.0 1 종로구 162820.0 153589.0 9231.0 25425.0 2 중구 133240.0 124312.0 8928.0 20764.0 3 용산구 244203.0 229456.0 14747.0 36231.0 4 성동구 311244.0 303380.0 7864.0 39997.0
pop_seoul.info() <class 'pandas.core.frame.DataFrame'> RangeIndex: 27 entries, 0 to 26 Data columns (total 5 columns): # Column Non-Null Count Dtype --- ------ -------------- ----- 0 구별 26 non-null object 1 인구수 26 non-null float64 2 한국인 26 non-null float64 3 외국인 26 non-null float64 4 고령자 26 non-null float64 dtypes: float64(4), object(1) memory usage: 1.2+ KB
cctv_seoul['최근증가율'] = (cctv_seoul['2014년'] + cctv_seoul['2015년'] + cctv_seoul['2016년']) / \ cctv_seoul['2013년도 이전'] * 100 cctv_seoul.sort_values(by='최근증가율', ascending = False).head() 구별 소계 2013년도 이전 2014년 2015년 2016년 최근증가율 22 종로구 1002 464 314 211 630 248.922414 9 도봉구 485 238 159 42 386 246.638655 12 마포구 574 314 118 169 379 212.101911 8 노원구 1265 542 57 451 516 188.929889 1 강동구 773 379 99 155 377 166.490765
pop_seoul['외국인비율'] = pop_seoul['외국인'] /pop_seoul['인구수'] pop_seoul['고령자비율'] = pop_seoul['고령자'] /pop_seoul['인구수'] pop_seoul.head() 구별 인구수 한국인 외국인 고령자 외국인비율 고령자비율 0 합계 10197604.0 9926968.0 270636.0 1321458.0 0.026539 0.129585 1 종로구 162820.0 153589.0 9231.0 25425.0 0.056695 0.156154 2 중구 133240.0 124312.0 8928.0 20764.0 0.067007 0.155839 3 용산구 244203.0 229456.0 14747.0 36231.0 0.060388 0.148364 4 성동구 311244.0 303380.0 7864.0 39997.0 0.025266 0.128507
# 외국인비율 상위 5개 pop_seoul.sort_values(by = '외국인비율', ascending = False).head() 구별 인구수 한국인 외국인 고령자 외국인비율 고령자비율 19 영등포구 402985.0 368072.0 34913.0 52413.0 0.086636 0.130062 18 금천구 255082.0 236353.0 18729.0 32970.0 0.073423 0.129253 17 구로구 447874.0 416487.0 31387.0 56833.0 0.070080 0.126895 2 중구 133240.0 124312.0 8928.0 20764.0 0.067007 0.155839 3 용산구 244203.0 229456.0 14747.0 36231.0 0.060388 0.148364
data_result = pd.merge(cctv_seoul, pop_seoul, on = '구별') data_result.head() 구별 소계 2013년도 이전 2014년 2015년 2016년 최근증가율 인구수 한국인 외국인 고령자 외국인비율 고령자비율 0 강남구 2780 1292 430 584 932 150.619195 570500.0 565550.0 4950.0 63167.0 0.008677 0.110722 1 강동구 773 379 99 155 377 166.490765 453233.0 449019.0 4214.0 54622.0 0.009298 0.120516 2 강북구 748 369 120 138 204 125.203252 330192.0 326686.0 3506.0 54813.0 0.010618 0.166003 3 강서구 884 388 258 184 81 134.793814 603772.0 597248.0 6524.0 72548.0 0.010805 0.120158 4 관악구 1496 846 260 390 613 149.290780 525515.0 507203.0 18312.0 68082.0 0.034846 0.129553
del data_result['2013년도 이전'] del data_result['2014년'] del data_result['2015년'] del data_result['2016년'] data_result.head() 구별 소계 최근증가율 인구수 한국인 외국인 고령자 외국인비율 고령자비율 0 강남구 2780 150.619195 570500.0 565550.0 4950.0 63167.0 0.008677 0.110722 1 강동구 773 166.490765 453233.0 449019.0 4214.0 54622.0 0.009298 0.120516 2 강북구 748 125.203252 330192.0 326686.0 3506.0 54813.0 0.010618 0.166003 3 강서구 884 134.793814 603772.0 597248.0 6524.0 72548.0 0.010805 0.120158 4 관악구 1496 149.290780 525515.0 507203.0 18312.0 68082.0 0.034846 0.129553
data_result.set_index('구별', inplace = True) data_result.head() 소계 최근증가율 인구수 한국인 외국인 고령자 외국인비율 고령자비율 구별 강남구 2780 150.619195 570500.0 565550.0 4950.0 63167.0 0.008677 0.110722 강동구 773 166.490765 453233.0 449019.0 4214.0 54622.0 0.009298 0.120516 강북구 748 125.203252 330192.0 326686.0 3506.0 54813.0 0.010618 0.166003 강서구 884 134.793814 603772.0 597248.0 6524.0 72548.0 0.010805 0.120158 관악구 1496 149.290780 525515.0 507203.0 18312.0 68082.0 0.034846 0.129553
data_result.corr(method='pearson') 소계 최근증가율 인구수 한국인 외국인 고령자 외국인비율 고령자비율 소계 1.000000 -0.343016 0.306342 0.304287 -0.023786 0.255196 -0.136074 -0.280786 최근증가율 -0.343016 1.000000 -0.093068 -0.082511 -0.150463 -0.070969 -0.044042 0.185089 인구수 0.306342 -0.093068 1.000000 0.998061 -0.153371 0.932667 -0.591939 -0.669462 한국인 0.304287 -0.082511 0.998061 1.000000 -0.214576 0.931636 -0.637911 -0.660812 외국인 -0.023786 -0.150463 -0.153371 -0.214576 1.000000 -0.155381 0.838904 -0.014055 고령자 0.255196 -0.070969 0.932667 0.931636 -0.155381 1.000000 -0.606088 -0.380468 외국인비율 -0.136074 -0.044042 -0.591939 -0.637911 0.838904 -0.606088 1.000000 0.267348 고령자비율 -0.280786 0.185089 -0.669462 -0.660812 -0.014055 -0.380468 0.267348 1.000000
import numpy as np np.corrcoef(data_result['고령자비율'], data_result['소계']) array([[ 1. , -0.28078554], [-0.28078554, 1. ]]) np.corrcoef(data_result['외국인비율'], data_result['소계']) array([[ 1. , -0.13607433], [-0.13607433, 1. ]]) np.corrcoef(data_result['인구수'], data_result['소계']) array([[1. , 0.30634228], [0.30634228, 1. ]])
#matplot import matplotlib.pyplot as plt from matplotlib import font_manager, rc plt.figure() plt.rc('font', family = 'Malgun Gothic') data_result['소계'].sort_values(ascending = True).plot(kind='barh', grid=True, figsize = (10,10)) plt.show()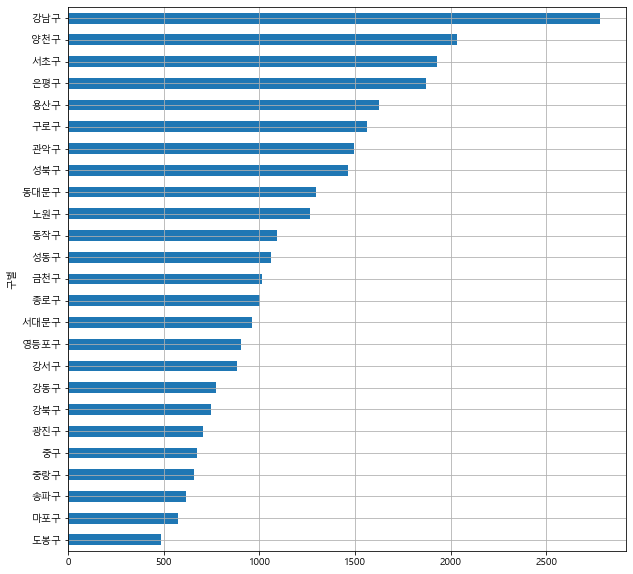
# 인구대비 cctv 비율컬럼 data_result['cctv비율'] = data_result['소계'] / data_result['인구수'] * 100 data_result.head() 소계 최근증가율 인구수 한국인 외국인 고령자 외국인비율 고령자비율 cctv비율 구별 강남구 2780 150.619195 570500.0 565550.0 4950.0 63167.0 0.008677 0.110722 0.487292 강동구 773 166.490765 453233.0 449019.0 4214.0 54622.0 0.009298 0.120516 0.170552 강북구 748 125.203252 330192.0 326686.0 3506.0 54813.0 0.010618 0.166003 0.226535 강서구 884 134.793814 603772.0 597248.0 6524.0 72548.0 0.010805 0.120158 0.146413 관악구 1496 149.290780 525515.0 507203.0 18312.0 68082.0 0.034846 0.129553 0.284673
data_result['cctv비율'].sort_values().plot(kind='barh', grid = True, figsize = (10,10)) plt.show()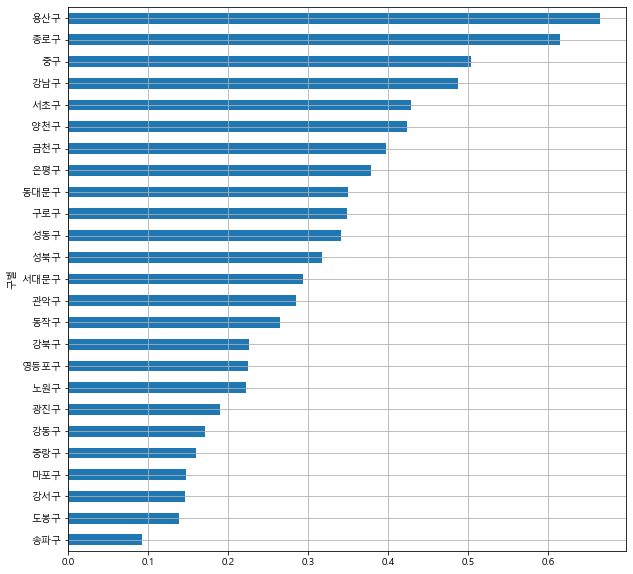
# 산점도 plt.figure(figsize = (6,6)) plt.scatter(data_result['인구수'], data_result['소계'], s= 50) plt.xlabel('인구수') plt.ylabel('cctv갯수') plt.grid() plt.show()
# 인구수와 소계 산점도, 회귀선 작성 # polyfit 최소제곱법을 이용한 상수값, 1 : 차수 fpl = np.polyfit(data_result['인구수'], data_result['소계'], 1) # ㅣ 직선 f1 = np.poly1d(fpl) fx = np.linspace(100000, 700000, 100) plt.figure(figsize = (10, 10)) plt.scatter(data_result['인구수'], data_result['소계'], s=50) plt.plot(fx, f1(fx), ls='dashed', lw=3, color='g') plt.xlabel('인구수') plt.ylabel('cctv') plt.grid() plt.show()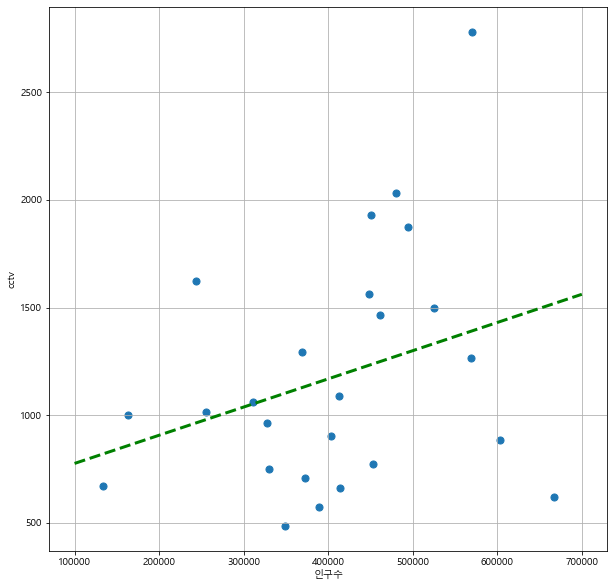
# 인구수와 소계 산점도, 회귀선 작성 # polyfit 최소제곱법을 이용한 상수값, 1 : 차수 fpl = np.polyfit(data_result['인구수'], data_result['소계'], 4) # ㅣ 직선 f1 = np.poly1d(fpl) # 인구수에 맞는 y값 fx = np.linspace(100000, 700000, 100) plt.figure(figsize = (10, 10)) plt.scatter(data_result['인구수'], data_result['소계'], s=50) plt.plot(fx, f1(fx), ls='dashed', lw=3, color='g') plt.xlabel('인구수') plt.ylabel('cctv') plt.grid() plt.show()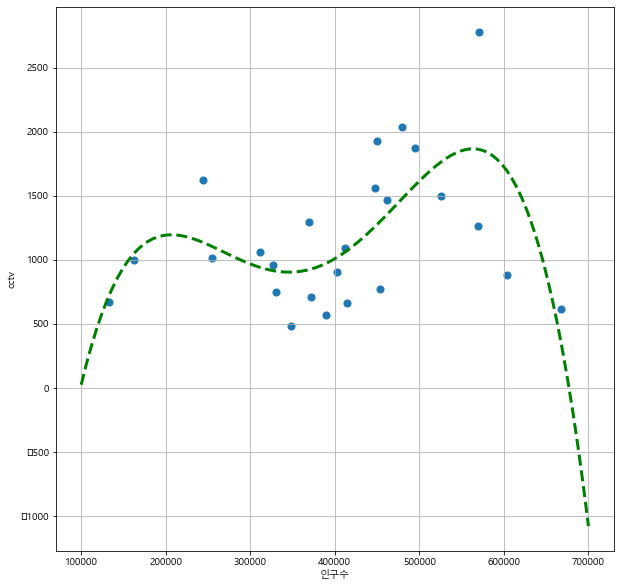
import numpy as np x = np.array([0., 1., 2., 3., 4., 5., 6., 7., 8., 9., 10.]) y = np.array([4.23620563, 6.18696492, 2.83930821, 5.00923197, 11.51299327, 12.91581993, 14.51838241, 14.34881875, 18.13566499, 20.1408104, 21.9872241]) fit1 = np.polyfit(x, y, 1) # 2개 상수 (+ 절편) fit2 = np.polyfit(x, y, 2) # 3개 상수 (+ 절편) fit3 = np.polyfit(x, y, 3) # 4개 상수 (+ 절편) print(fit1) print(fit2) print(fit3) # [1.92858279 2.34176099] # [0.05915413 1.33704154 3.22907288] # [-0.02808825 0.48047788 -0.26960637 4.24024989]
num = len(x) for i in range(num) : fit1 = 1.92858279*x + 2.34176099 fit2 = 0.05915413*x**2 + 1.33704154*x + 3.22907288 fit3 = - 0.02808825*x**3 + 0.48047788*x**2 - 0.26960637*x + 4.24024989 print(fit3) # [ 4.24024989 4.42303315 5.39824267 6.99734895 9.05182249 11.39313379 # 13.85275335 16.26215167 18.45279925 20.25616659 21.50372419]
# xy 산점도 와 회귀선 plt.scatter(x, y) plt.plot(x, y) plt.plot(x, fit1) plt.show()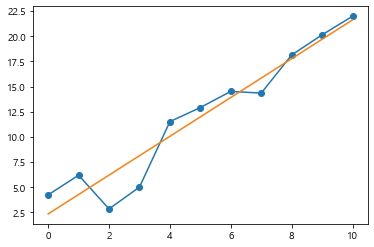
# xy 산점도 와 회귀선 plt.scatter(x, y) plt.plot(x, y) plt.plot(x, fit3) plt.show()
# 산점도 + 회귀선, 산점도에 색상을 회귀선과의 거리로 표시 # 회귀선을 위한 상수 fpl = np.polyfit(data_result['인구수'], data_result['소계'], 2) # fpl상수값을 이용하여 y값을 계산하기 위한 함수 f1 = np.poly1d(fpl) # X축값, 10만 ~ 70만 까지 100등분 fx = np.linspace(100000, 700000, 100) # data_result 인구수에 맞는 회귀선의 y값 # 절대값 data_result['오차'] = np.abs(data_result['소계'] - f1(data_result['인구수'])) df_sort = data_result.sort_values(by = '오차', ascending = False) # 그래프 작성 plt.figure(figsize = (14,10)) plt.scatter(data_result['인구수'], data_result['소계'], c =data_result['오차'], s=50) plt.plot(fx, f1(fx), ls = 'dashed', lw = 3, color = 'g') # 점에 구 이름 표시 for n in range(10) : # 라벨링 // 절대값 오차가 많은 구10개 정보 표시 plt.text(df_sort['인구수'][n]*1.02, df_sort['소계'][n]*0.98, # 약간 밑으로 df_sort.index[n], fontsize = 15) plt.xlabel('인구수') plt.ylabel('cctv갯수') plt.colorbar() plt.grid() plt.show()
반응형
'Data_Science > Data_Analysis_Py' 카테고리의 다른 글
| 22. auto-mpg || 회귀분석 (0) | 2021.11.24 |
|---|---|
| 21. 서울시 범죄율 분석 || MinMaxscalimg (0) | 2021.11.24 |
| 19. 세계음주데이터2 (0) | 2021.11.23 |
| 18. 세계음주 데이터 분석 (0) | 2021.11.03 |
| 17. 서울 기온 분석 (0) | 2021.11.02 |